Your QC report
Computed from public 10x PBMC 3k dataset (example run). The input file has already been deleted;
this report expires in 7 days.
Suggested thresholds for this dataset
| Filter | Suggested | Common tutorial default |
|---|---|---|
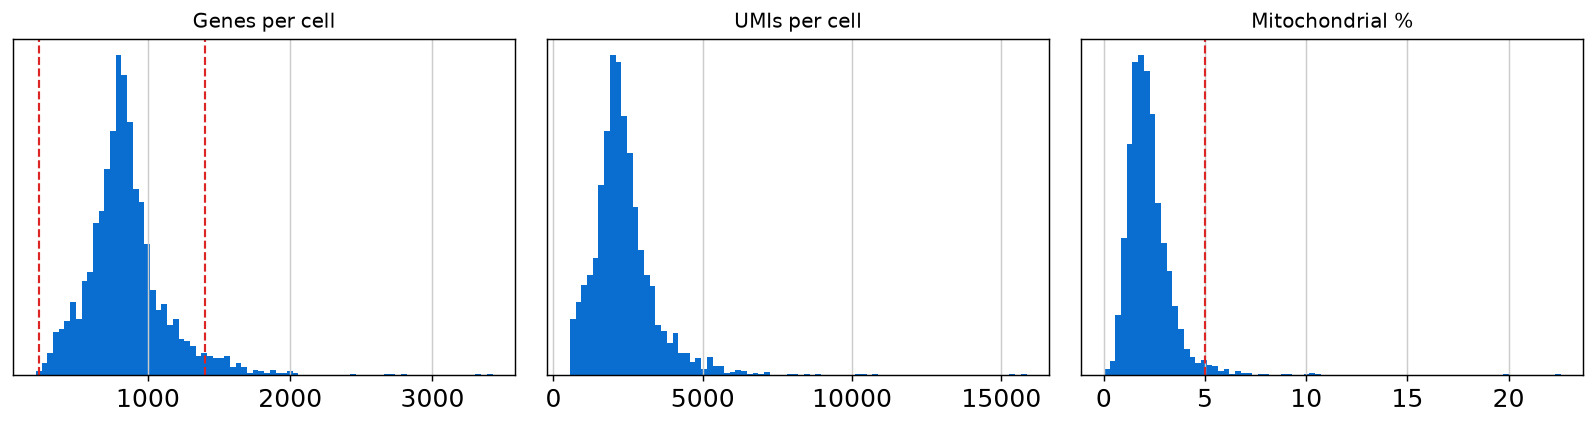
| Minimum genes per cell | 232 | 200 |
| Maximum genes per cell | 1,402 | 2,500 |
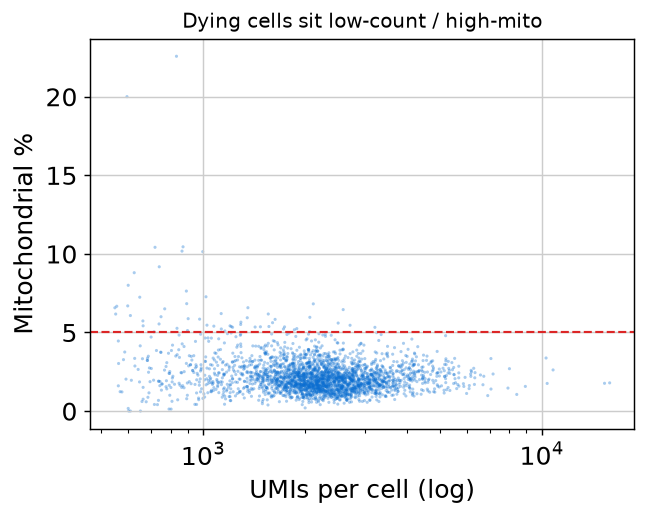
| Maximum mitochondrial % | 5% | 5% |
| Cells retained | 2,523 of 2,700 (6.6% removed) | |
Suggestions are median ± 3 MAD of your own distributions, floored at 200 genes. They are a starting point, not a verdict — tissue biology beats any formula.
Things worth a second look
Distributions
Barcode rank
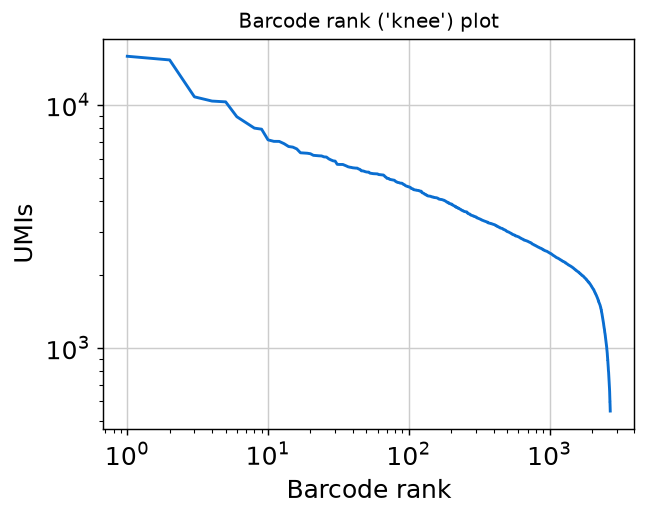
The classic first plot. A sharp knee means cells and empty droplets are cleanly separated; a smooth slope means empty droplets are probably still in the matrix.
Most abundant genes
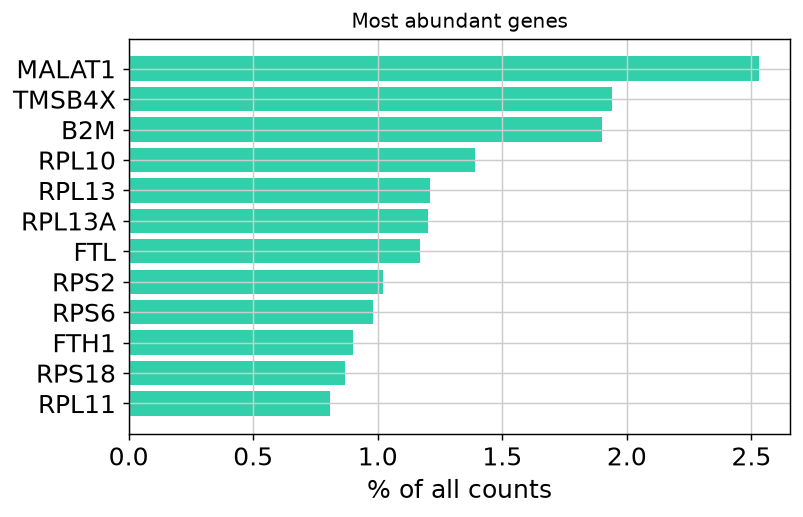
The top 10 genes carry 14.2% of all counts here. When this share is high, or when haemoglobin or mitochondrial genes dominate, you are usually looking at ambient RNA rather than biology.
| Gene | % of all counts |
|---|---|
MALAT1 | 2.53% |
TMSB4X | 1.94% |
B2M | 1.9% |
RPL10 | 1.39% |
RPL13 | 1.21% |
RPL13A | 1.2% |
FTL | 1.17% |
RPS2 | 1.02% |
RPS6 | 0.98% |
FTH1 | 0.9% |
Share it
The same report as a PDF — the thing you forward to a supervisor or a core facility. No attribution required, and the uploaded file has already been deleted.
Take the numbers with you
Per-cell metrics for every barcode — genes, UMIs, mitochondrial percentage, complexity, and whether it passes the suggested filter.
↓ Download per-cell metrics (CSV) · ↓ Download this report as one file (figures embedded — send it to a colleague, it works offline and does not expire)
What the full analysis of this dataset would cost
Your file has 2,700 cells. A standard single-cell analysis at that scale is $380 – $650 indicative.
Lower if the object is already processed and you only need specific modules. Higher if the design needs integration, trajectory or cell–cell communication on top. A written fixed price follows before any work starts — and if your design cannot support the comparison you want, we say so instead of billing for it.
The full run adds doublet removal, ambient-RNA correction, clustering, annotation, differential expression at subject level, and the figures you would submit — with the code that produced them.
→ Get a fixed quote · price it yourself · see a complete sample deliverable