Sample deliverable — single-cell ATAC-seq
scATAC is not scRNA with different features. The quality metrics are different, the normalisation is different, and there is one routine step — dropping the first LSI component — that is applied almost silently and changes the cluster boundaries. This run on public data (10x Genomics 5k PBMC scATAC (public)) reports what that step actually did.
Do this on your own data: scATAC is not scRNA with different features, and the quality metrics that decide an ATAC run do not appear in any RNA report. Reference QC values measured on public ATAC data, to compare your own run against: omics.hstgenomics.com/qc-reference. What to check in a delivered scATAC analysis: omics.hstgenomics.com/guides/scatac-analysis-what-to-check.
Want it done rather than shown? We do analysis only — send the Cell Ranger ATAC or Cell Ranger ARC output and get the peak-level analysis with the code that produced it, at a fixed price agreed before any work starts: omics.hstgenomics.com/quote.
1 · The QC metrics are not the RNA ones
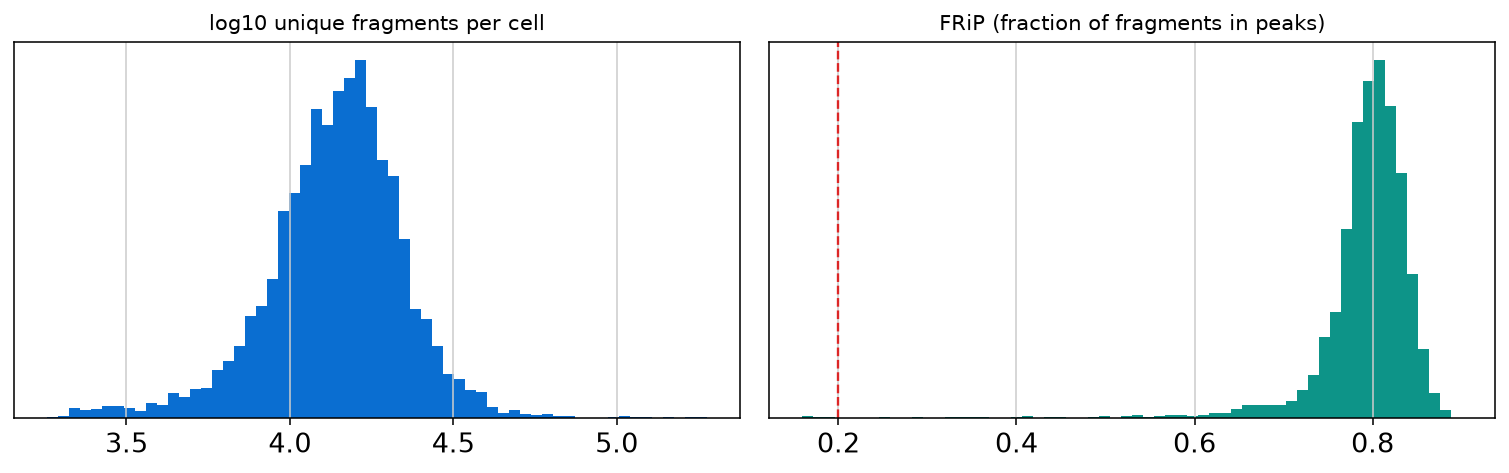
There is no gene count and no mitochondrial percentage to filter on. What matters is how many unique fragments a cell yielded, and FRiP — the fraction of those fragments that land inside called peaks, which is the signal-to-background measure. A cell can have plenty of fragments and still be unusable if they are scattered outside peaks. Here the median is 14,256 fragments at FRiP 0.801, and 0.554 of fragments fall near transcription start sites — a healthy library. Only 0.2% of barcodes were dropped, because 10x had already called cells.
2 · TF-IDF and LSI, not log-CPM and PCA
The matrix is close to binary: a given peak is either accessible in a cell or not, and counts above one carry little extra information. The standard treatment is TF-IDF weighting followed by SVD ("LSI"). One detail is worth stating because we measured it rather than assumed it: the IDF term has to be the plain ratio of cells to peak-occurrences. We first wrote a log-scaled variant, which looks harmless. It is not — see the next section for what it costs.
3 · The first component is sequencing depth — and dropping it is not the whole story
In LSI the leading component almost always tracks library depth rather than biology, so the convention is to discard it. Here that is unambiguous: component 1 correlates with log depth at r = 0.967. No biological axis explains 97% of a depth signal; it is the depth.
But after dropping it, a later component still correlates at r = 0.517. So we asked the question that actually matters — does it change the answer? Clustering with only component 1 removed gives 13 clusters; removing every depth-correlated component gives 14, and the two labellings agree at ARI 0.689. That is not agreement. Roughly a third of the pairwise cluster structure depends on which of two entirely defensible QC choices was made — a choice most pipelines make for you without a line in the methods.
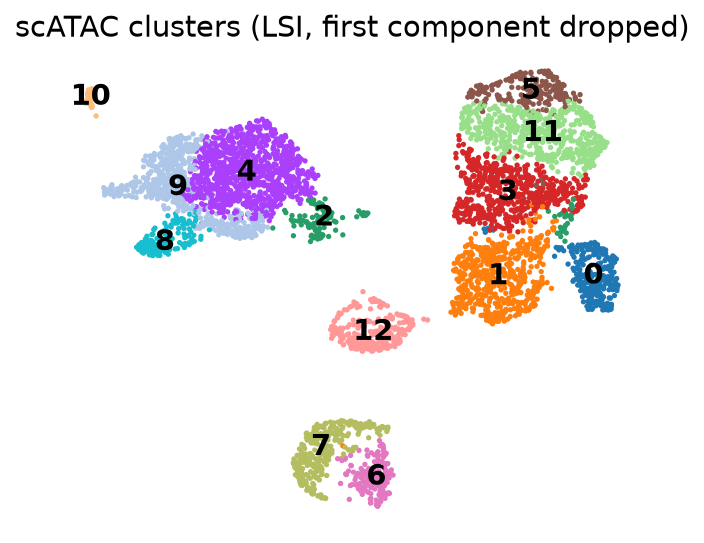
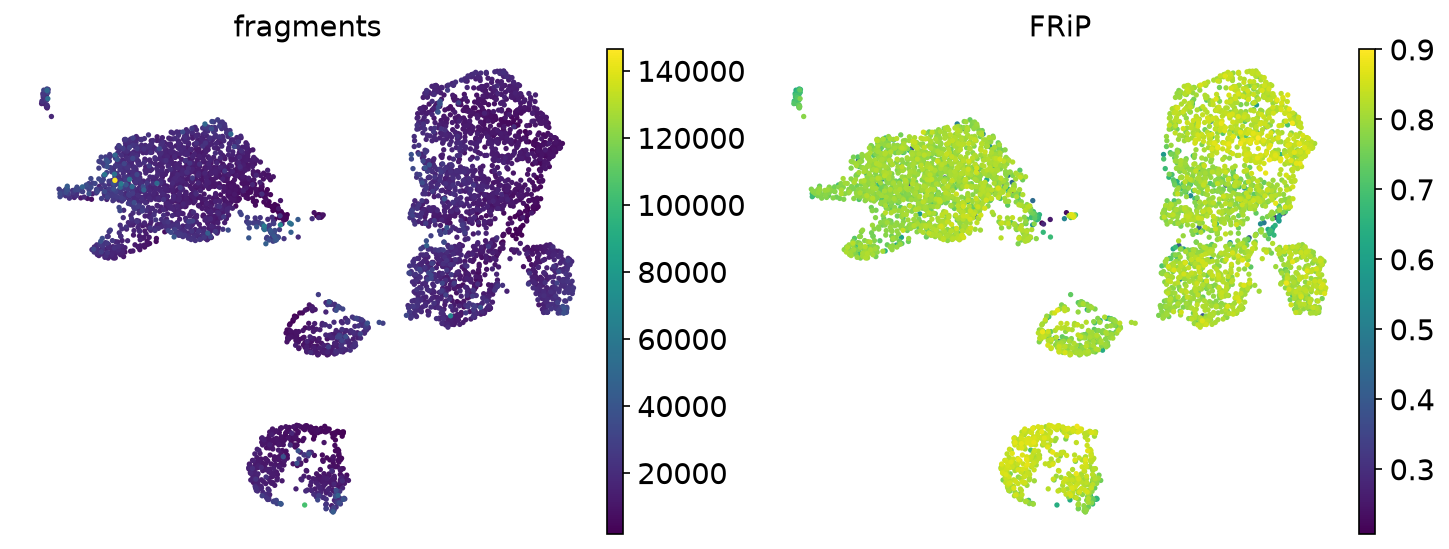
The honest reading is not "the later component is noise, delete it". Cell types genuinely differ in how much open chromatin they carry, so depth correlation is not proof of an artefact. The reading is that a cluster count from scATAC is a conditional number, and the condition belongs in the report. Median depth already varies 2.77× across the clusters we kept.
What you would receive
The figures above, the metrics file behind every number on this page, the script that produced them, and a methods paragraph that states the QC thresholds, the normalisation, which components were removed, and how sensitive the result was to that removal. If a reviewer asks why there are 13 clusters, the answer is already written down.
Download the script · metrics.json · Ask what your dataset would cost