Sample deliverable — deconvolution, with the accuracy measured
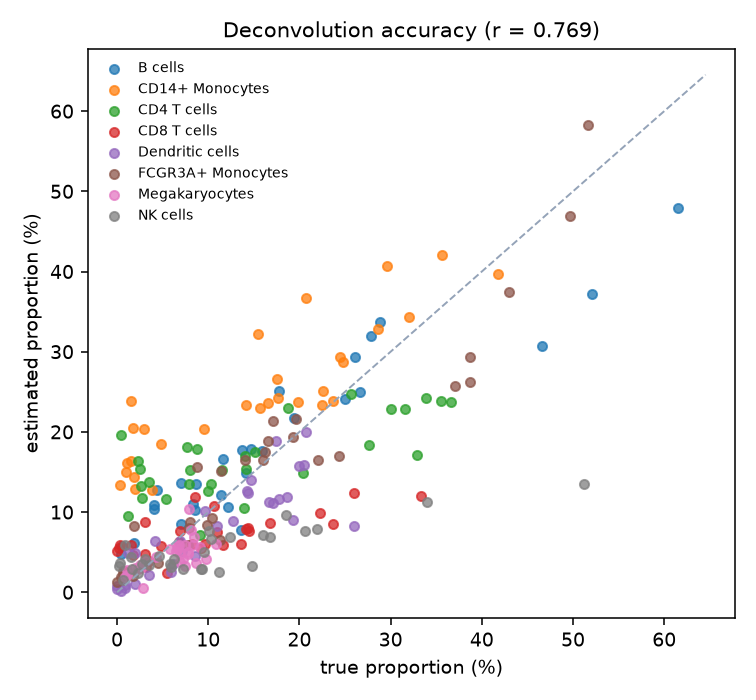
When you buy deconvolution of bulk RNA-seq you normally receive a pie chart and no way to know whether it is right. Here the same analysis is run where the true answer is known, so the accuracy can be stated as a number — including where it is poor.
Do this on your own data: the accuracy measured here exists because there is ground truth; on your bulk samples it is the reference you choose that decides the answer. Price deconvolution together with the bulk analysis it sits on: omics.hstgenomics.com/cost-calculator. When deconvolution is the cheaper answer and when it is the wrong one: omics.hstgenomics.com/guides/deconvolution-or-single-cell.
Want it done rather than shown? We do analysis only — send a counts table and the sample sheet and get the differential expression, the enrichment and the code that produced them, at a fixed price agreed before any work starts: omics.hstgenomics.com/quote.
1 · How ground truth was created
Single-cell PBMC data from 8 donors (GEO GSE96583 (Kang et al. 2018) — control PBMC, 8 donors). Four donors were used to build the cell-type reference signature; the other four were used to construct 30 synthetic bulk samples by pooling 800 cells in randomly drawn proportions. The deconvolution never sees those proportions.
Why the donor split matters
Reference and test sets are split by donor, not by randomly assigning cells. If the same person's cells appear in both, the signature already knows that individual's expression and accuracy is flattered. It is the most common way a deconvolution benchmark fools itself.
2 · Estimated versus true
3 · Where it works and where it does not
| Cell type | True (mean) | Estimated (mean) | RMSE | r |
|---|---|---|---|---|
| B cells | 16.7% | 17.8% | 6.24 pp | 0.934 |
| CD14+ Monocytes | 15.2% | 24.6% | 11.15 pp | 0.881 |
| CD4 T cells | 14.8% | 16.7% | 8.92 pp | 0.718 |
| CD8 T cells | 9.6% | 6.9% | 7.12 pp | 0.724 |
| Dendritic cells | 10.4% | 8% | 4.83 pp | 0.851 |
| FCGR3A+ Monocytes | 17% | 16.3% | 4.88 pp | 0.947 |
| Megakaryocytes | 5.9% | 4.6% | 2.49 pp | 0.671 |
| NK cells | 10.4% | 5.2% | 10.02 pp | 0.859 |
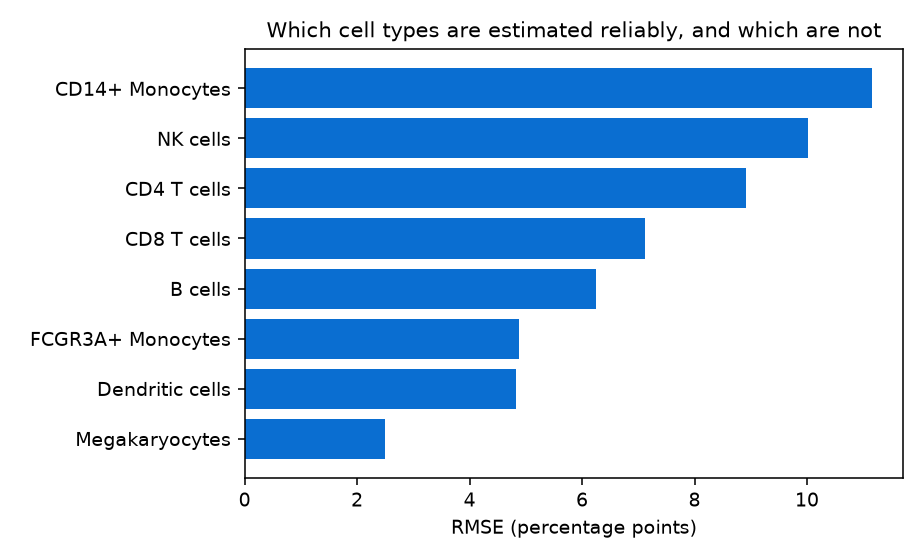
The honest summary: overall correlation 0.769 with an RMSE of 7.48 percentage points. Two populations are systematically biased — CD14+ monocytes are over-estimated and NK cells under-estimated by roughly a factor of two. This is characteristic of a plain least-squares deconvolution: signatures that share expression programmes compete, and the more abundant, more transcriptionally distinctive population absorbs signal from its neighbours.
4 · What we would do about it on a real project
- Restrict the signature to markers that are specific by a stated criterion, rather than using the top variable genes wholesale.
- Use a method with explicit noise and spillover modelling (CIBERSORTx, MuSiC, BayesPrism) and compare them against the same ground truth rather than trusting one.
- Report the benchmark alongside the result, so a reader knows which of your cell types can be interpreted and which cannot.
- Where a population fails the benchmark, say so in the results rather than quietly including it in the figure.
The deliverable that matters is not the pie chart. It is the pie chart plus the sentence "these three cell types are reliable to within N percentage points, and these two are not".
→ Get a quote · the script · composition analysis in single-cell data