Sample deliverable — Multiome (RNA + ATAC in the same cells)
Multiome is usually sold with a sentence about chromatin opening and genes switching on. What makes it worth the money is narrower and more useful: because both measurements come from the same cell, agreement between them becomes something you can measure instead of assume. This run on public data (10x Genomics PBMC granulocyte-sorted 3k Multiome (public)) measures it twice.
Do this on your own data: Multiome is usually sold with one sentence about linking peaks to genes; whether your cells support that link is an empirical question about your data. Answer four questions and get a concrete plan: which modules a multiome project needs, what to send and what comes back: omics.hstgenomics.com/plan. The chromatin half on its own, with the metrics that belong to it: omics.hstgenomics.com/sample-atac.
Want it done rather than shown? We do analysis only — send the Cell Ranger ATAC or Cell Ranger ARC output and get the peak-level analysis with the code that produced it, at a fixed price agreed before any work starts: omics.hstgenomics.com/quote.
1 · Quality control has to pass twice
A multiome cell can be good on one side and useless on the other, and a single-modality filter will not notice. Of 2,711 barcodes, 41 failed on RNA while their ATAC was fine, and 76 failed on ATAC while their RNA was fine. Both groups have to go, and a report should say how many went for which reason.
A warning about this specific public dataset. Its own
per-barcode metrics file ships with gex_umis_count and gex_genes_count as zero for every
one of its 662,636 rows — the columns exist, are correctly named and correctly typed, and are simply never filled.
Any pipeline that filters on gex_umis_count >= 1000 discards 100% of cells without an error
message. We compute those metrics from the matrix instead, and refuse to filter on any column that is entirely
zero. This is a reference dataset from the platform vendor; the same class of defect in a client's file would be
far less visible.
2 · Same cells, clustered twice — do the two halves agree?
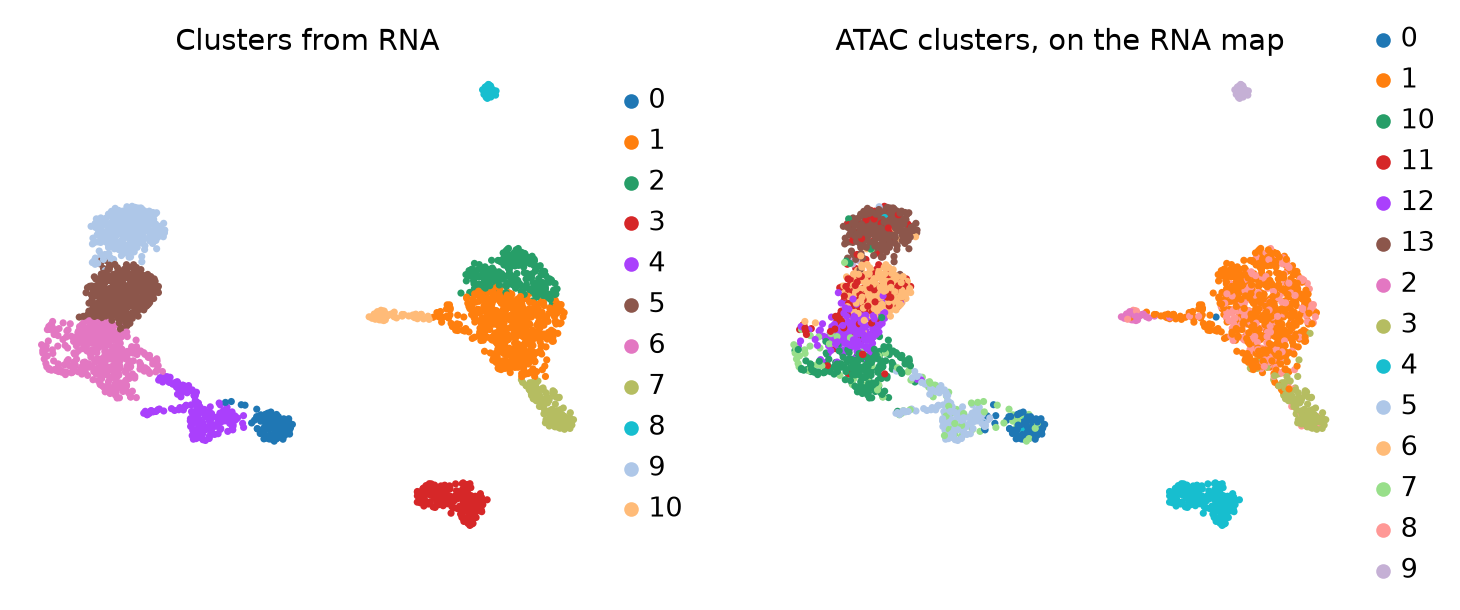
Clustering only on RNA gives 11 clusters. Clustering the same cells only on ATAC gives 14. Between the two labellings, ARI = 0.553 (NMI 0.733). Broad lineages match — the disagreement is in where the boundaries fall. The median RNA cluster has 77% of its cells inside a single ATAC cluster, but the worst one (cluster 6) has only 48%: it is split roughly in half by chromatin.
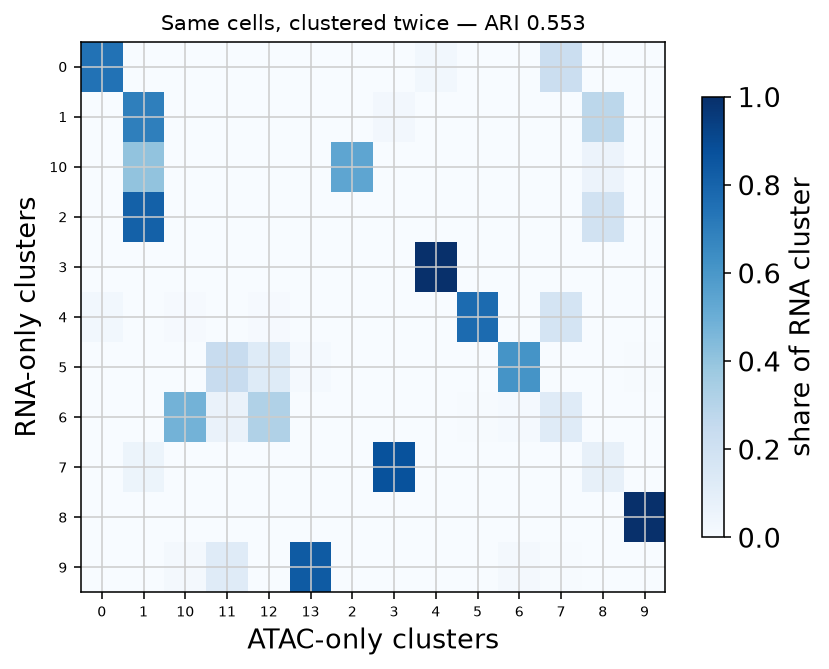
That number is the reason to state which modality drove an analysis. A "cell type" in a multiome paper is a decision, not an observation, and readers cannot tell which one was made unless it is written down.
3 · Does open chromatin near a gene predict its expression?
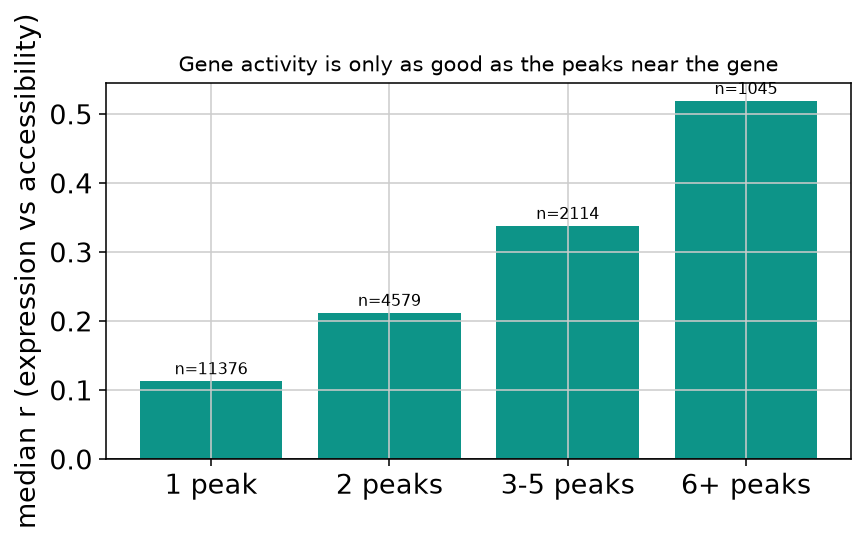
Gene activity — counting accessible peaks near a gene — is routinely used to label ATAC data with familiar marker genes. We computed it for 21,682 genes from the file's own coordinates (gene body ± 2 kb) and correlated it with measured expression across clusters. Overall the median correlation is 0.178, and 37.6% of genes are outright negative.
That average hides the thing that matters. Split by how many peaks are actually near the gene:
| Peaks near the gene | Genes | Median r | Negative |
|---|---|---|---|
| 1 peak | 11,376 | 0.113 | 41.8% |
| 2 peaks | 4,579 | 0.212 | 35.7% |
| 3-5 peaks | 2,114 | 0.338 | 28.6% |
| 6+ peaks | 1,045 | 0.519 | 18% |
The median gene has 1 nearby peak. For those genes the score is close to noise; for the 1,045 genes with six or more, the median correlation is 0.519. Gene activity is not a property of the method — it is a property of how well covered each individual gene is, and that number is almost never reported alongside it.
4 · The check that caught our own mistake
Lineage markers should show expression and accessibility rising in the same cell populations. Our first version of this check asked whether the highest-expression cluster was exactly the highest-accessibility cluster, and only three of ten markers passed — which looked like a failed analysis. It was a failed test: CD3D's expression is highest across four T-cell clusters and its accessibility is highest across the same four, differing only in which of them ranks first. Replaced with a rank correlation across clusters, 9 of 10 markers agree.
| Gene | Nearby peaks | Rank correlation across clusters | Agrees |
|---|---|---|---|
| CD3D | 2 | 0.674 | yes |
| CD3E | 2 | 0.909 | yes |
| IL7R | 2 | 0.627 | yes |
| MS4A1 | 1 | 0.583 | yes |
| CD79A | 2 | 0.4 | no |
| LYZ | 1 | 0.718 | yes |
| CD14 | 2 | 0.536 | yes |
| NKG7 | 1 | 0.573 | yes |
| GNLY | 2 | 0.7 | yes |
| FCGR3A | 1 | 0.651 | yes |
We publish this because the distinction matters when you are paying for an analysis: a checking procedure that is too strict produces false alarms, and one that is too loose produces false comfort. Either way the number you are shown depends on a choice someone made without telling you.
What you would receive
Both clusterings, the agreement measured rather than asserted, gene activity reported with its coverage, and a methods paragraph naming every threshold and every component removed. Download the script · metrics.json · Ask what your dataset would cost