Sample deliverable — RNA velocity
Velocity produces a figure full of arrows, and an arrow figure is persuasive whether or not the model behind it fits. This run on public data (scVelo pancreas endocrinogenesis (Bastidas-Ponce et al. 2019, public)) is reported the way it should be: with the three numbers that decide whether the arrows mean anything.
Do this on your own data: velocity draws a field full of arrows whatever you feed it; the part worth reading is the diagnostics, and those are specific to your run. The exact scripts that produced every figure on this page are downloadable, so the same diagnostics can be run on your own object: omics.hstgenomics.com/code. The same kind of question answered with pseudotime instead: omics.hstgenomics.com/sample-trajectory.
Want it done rather than shown? We do analysis only — send a count matrix, an h5ad or a Seurat object, Cell Ranger output or a public accession and get the analysis back with the code that produced it, at a fixed price agreed before any work starts: omics.hstgenomics.com/quote.
1 · Is there enough unspliced signal to try at all?
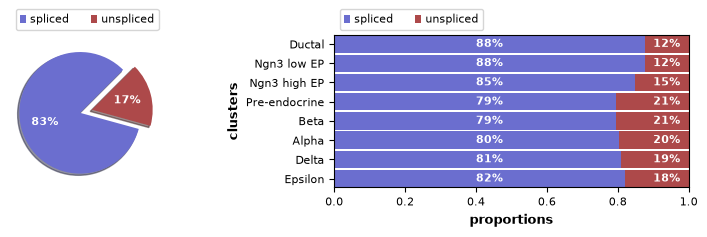
Velocity infers direction from the ratio of unspliced to spliced RNA. Below roughly 10% unspliced there is not enough signal and the method should not be run — but it will still produce arrows if you ask it to. Here unspliced reads are 16.3%, which is workable. This number belongs in the report; most velocity figures never mention it.
2 · How confident is each arrow?
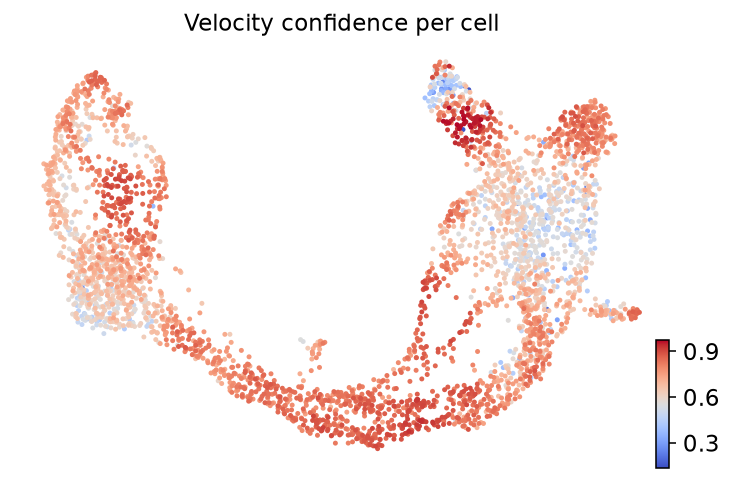
Velocity confidence measures how consistent a cell's inferred direction is with its neighbours. Median here is 0.729, and 6.4% of cells fall below 0.5 — those regions should not carry a narrative, however convincing the arrows look.
3 · Does it recover development that is already known?
Pancreatic endocrinogenesis runs ductal → Ngn3-low → Ngn3-high → pre-endocrine → the four endocrine fates. The velocity pseudotime reproduces exactly that ordering, without being told:
| Cell type | Median velocity pseudotime |
|---|---|
| Ductal | 0.151 |
| Ngn3 low EP | 0.227 |
| Ngn3 high EP | 0.718 |
| Pre-endocrine | 0.922 |
| Beta | 0.953 |
| Alpha | 0.927 |
| Delta | 0.905 |
| Epsilon | 0.902 |
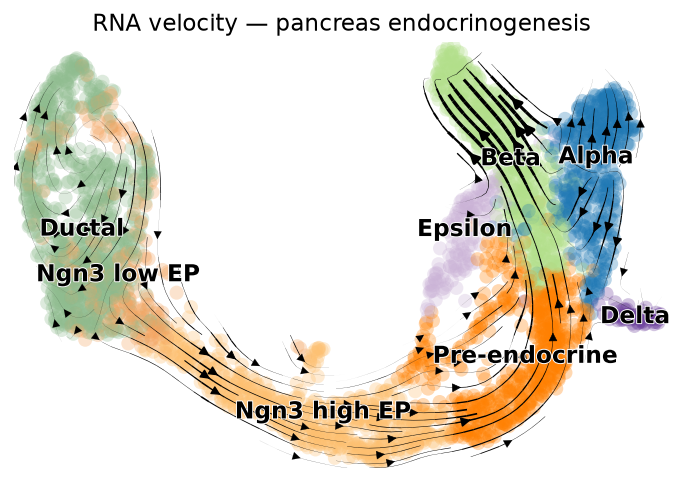
If the arrows had pointed from endocrine cells back to progenitors, the honest conclusion would be that the model did not fit — not that we had discovered de-differentiation. Recovering a known trajectory is the minimum bar before anyone reports an unexpected one.
A note on tooling
The stochastic velocity mode in the current scVelo release crashes against recent NumPy versions; this run uses the deterministic mode, which takes a different code path. We mention it because it is the kind of thing that decides whether a delivery arrives on time — and because it is a reason to run the analysis rather than copy a tutorial.
What a full velocity project adds
- Both dynamical and steady-state models compared, rather than whichever one ran.
- Driver genes behind the inferred direction, with their phase portraits.
- Latent time alongside pseudotime, and what to conclude when they disagree.
- An explicit statement of where confidence is too low to interpret.
- The script: see the code.