Sample deliverable — imaging-based spatial (Xenium)
Xenium and Visium are both called spatial and share almost none of their analysis. Xenium resolves single cells, which is what you are paying for; in exchange it measures only the genes on the panel, and it adds a failure mode Visium does not have — cell segmentation. This run on public data (10x Genomics Xenium human breast cancer FFPE, replicate 1 (public)) reports the three numbers that decide whether the result is usable.
Do this on your own data: Xenium and Visium are both called spatial and share almost none of the analysis; the panel you ordered decides what is answerable at all. Imaging-based spatial is priced per section — the calculator gives the range for the number of sections you have: omics.hstgenomics.com/cost-calculator. How the three spatial platforms differ before you commit to one: omics.hstgenomics.com/guides/visium-xenium-stereoseq-which-platform.
Want it done rather than shown? We do analysis only — send the Space Ranger, Xenium or Stereo-seq output and get the spatial analysis with the overlays, the tables and the code that produced them, at a fixed price agreed before any work starts: omics.hstgenomics.com/quote.
1 · The panel is the ceiling
This assay measures 313 genes. Anything outside that list is not "undetected" — it was never asked about. That single fact rules out a whole category of question: you cannot discover an unexpected cell type, and you cannot claim a gene is absent. It is a targeted assay answering targeted questions, and the mismatch is a design error rather than an analysis failure.
Concretely, we asked whether seven common breast-tissue lineages could be identified from this panel:
| Lineage | Markers on panel | Which ones |
|---|---|---|
| Epithelial / luminal | 3/4 | EPCAM, KRT8, ESR1 |
| Basal / myoepithelial | 3/4 | KRT14, KRT5, ACTA2 |
| T cells | 4/4 | CD3D, CD3E, CD8A, IL7R |
| B / plasma | 2/3 | MS4A1, CD79A |
| Myeloid | 4/4 | ITGAX, CD68, LYZ, CD14 |
| Endothelial | 2/3 | PECAM1, VWF |
| Fibroblast | 3/4 | PDGFRA, PDGFRB, LUM |
All seven are represented, but five of them only partially — KRT18, TP63, JCHAIN, CDH5 and DCN are absent. That is fine for identifying these populations and not fine if one of those genes is the point of your experiment. Checking this before the run costs nothing; checking it afterwards costs the experiment.
2 · Negative controls set the floor
The panel ships with 159 blank codeword, 41 negative control codeword, 28 negative control probe — probes and codewords that should detect nothing. Whatever they pick up is the background under every real measurement, exactly as isotype controls work in CITE-seq. Here they carry 0.095% of all signal, roughly 766.5:1 per feature — a clean run. 13.7% of cells contain at least one control count, which is the more honest way to say it: background is not zero, it is small and spread thin.
If this number were a few percent, low-expressing genes in the panel would be uninterpretable, and no clustering choice downstream would repair that.
3 · Segmentation is the risk Visium does not have
Every transcript is assigned to a cell by an algorithm drawing boundaries on an image. Draw them wrong and the expression profile is a blend of two cells — which looks exactly like a novel intermediate state. Two cheap diagnostics:
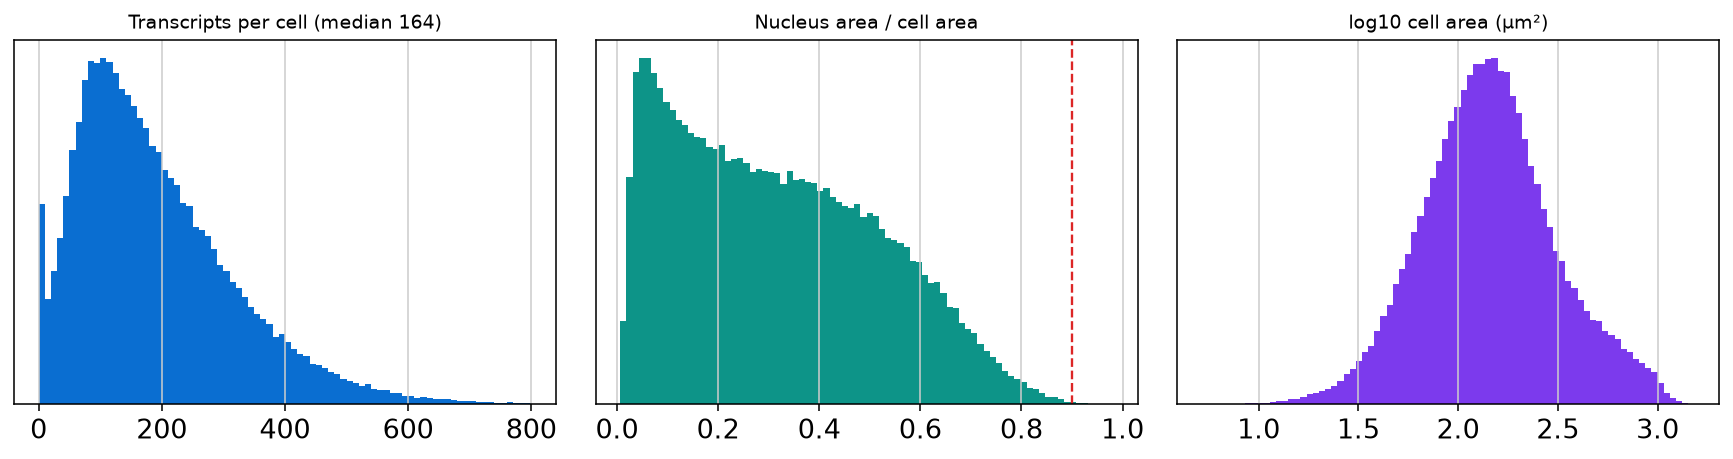
- Nucleus as a share of cell area. Median here is 0.294, and 0% of cells are nucleus-only (ratio above 0.9). A large nucleus-only population means cytoplasm was not captured, and those profiles are biased toward nuclear transcripts.
- Oversized cells. 0.5% sit above the 99.5th percentile of area — the population where two cells most often become one.
Median transcripts per cell is 164, one to two orders of magnitude below a droplet scRNA experiment. Applying a scRNA threshold such as "at least 500 genes per cell" would delete the entire section. We filtered at 10 transcripts, removing 2.3% — including 1,417 segmented objects that contained no transcripts at all, which is itself a segmentation report card.
4 · Does the tissue come back?
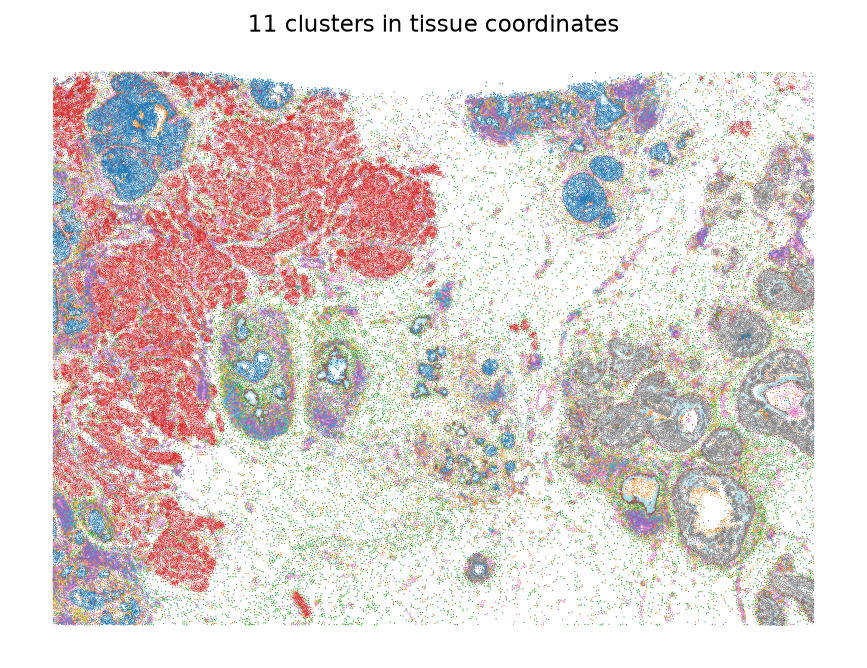
Clustering the 164,000 retained cells gives 11 clusters, and 7 of 7 lineages appear among their top markers — epithelial (KRT8, EPCAM, FOXA1), basal (KRT14, KRT5, MYLK), myeloid (LYZ, FCER1G), fibroblast (LUM, POSTN). Plotted back onto tissue coordinates the clusters form contiguous structures rather than noise, which is the minimum bar before any spatial claim.
A note on how this nearly went wrong
The cell metadata (areas, coordinates, control counts) lives in a separate file whose identifiers are integers, while the matrix barcodes are strings. Joining them naively matches nothing — and pandas does not raise, it returns a column of NaN. Our first run therefore proceeded for twelve minutes on entirely empty metadata before failing at an unrelated step. The script now asserts that the join matched and refuses to continue on missing values. We mention it because the same silent failure in a delivery would produce a report full of plausible numbers that mean nothing.
What you would receive
Panel coverage checked against the biology you care about, background quantified from the negative controls, segmentation diagnostics, clustering with markers, and a methods paragraph naming every threshold. Download the script · metrics.json · Ask what your dataset would cost